Facebook And Twitter By The Numbers

Social networking giants Facebook and Twitter are both currently experiencing substantial growth rates, based on data from June 2010, although the story behind the numbers spells out very different potential futures for the two social supersites.  Facebook, on one hand, is seeing remarkable international growth and is fast becoming the leader in accessing third-party sites.  On the contrary, Twitter’s domestic growth in June was almost unparalleled and is making a name for itself with Twitter Search, especially for news and information.

Facebook’s June growth took a major hit in the domestic market: in May, the social networking site recorded 7.8 million new users, while in June it recorded a mere 320,800 new users.  The drop was primarily due to lack of growth in the 45-54 age group, the group most likely to be affected by the well-publicized Facebook Privacy Policy controversy.  Facebook’s bread and butter group, the 18-44 year-olds, remained constant, although record growth in June came not from the U.S. market, but rather from Indonesia and India.  Indonesia, the third-largest Facebooking country, recorded 1.2 million new users in June, while India recorded almost 990,000 the same month.

Facebook is also providing the most logins to third-party sites, predominantly in the entertainment field, but in other industries as well.  What this data tells us is people trust the opinions and experiences of their online “friends” and are likely to visit many of the sites that pop up in their newsfeed.  In this way, developing and promoting a Facebook page for your business is an easy and relatively cheap way to bring additional visitors and potential business to your site, as well as providing a good forum for distributing sales, promotions, and updates.

Twitter’s record growth this past month is also inspirational: Twitter saw 800 million search queries per day during June.  That’s right, search queries, not tweets.  According to co-founder Biz Stone, that is up 33% since April, ensuring those in the search industry take notice.

What accounts for this sharp increase in search activity?  Possibly the early-May development of embedded tweets, where websites can post tweets on their site quickly and easily, as well as an in-house analytics suite and partnerships with companies such as TomTom and Foursquare to provide localized search.

It is also not surprising Twitter Search is becoming the number one site for searches about news and information; their slogan “See what’s happening — right now” pretty much says it all.  Searchers know Twitter will provide them the latest updates in real-time…that is, if they can weed through the massive amounts of tweets.

What can we take away from these numbers?  We recognize people are flocking to Facebook and Twitter around the world in record numbers, and using these sites to access everything from current events to local businesses, travel sites, and charitable organizations.  According to Jake Coronado at Titan Growth®, “The social networking sites are where people are, so naturally, that’s where businesses need to be also.”

To decide which of these, or any other online social media tools is appropriate for your business, we recommend consulting an online marketing agency that can present the pros and cons these platforms offer for your industry.  With the marketing industry rapidly changing before our eyes, businesses need to stay flexible to ensure they are getting in front of their potential client base, and lucky for you, that client base can now spread the word about your business with just the click of a mouse.

Contributed by Amanda Finch, VP Operations

Google, Yahoo, And Bing Square Off

According to recently-released data from industry sources, Google’s market share dropped yet again while that of Bing and Yahoo! continued to climb.  However, upon closer inspection, Google is still safely in the lead, at least for the foreseeable future.

Google’s market share percentage dropped 1.1% from May to June 2010, while Bing and Yahoo! each gained 0.6%.  Is this a cause of concern for the leading search giant?  Most likely not.  Google still holds a significant 62.6% of search market share for June.  Furthermore, questions arise over whether Bing and Yahoo! should be allowed to include in their search data the activity generated by photo slideshows and other contextual searches.  This type of online action is not a true “search” activity, and often a user flipping through the photos does not realize their click counted as a search for information.  However, those clicks are totaled into the overall search data, whether we like it or not.

All three search engines seemed to fare well in terms of search volume this month.  When we look at the overall search volume, which increased from May to June, Google actually increased in the sheer volume of searches by 134 million, or up 1.3%.  Bing increased by 152 million, or 7.3%, and Yahoo! increased by 206 million, or 6.6%.  So, it appears everyone was a winner in terms of volume.  Industry experts have been speculating what the upcoming merger between Bing and Yahoo! might do in terms of changing overall search volume and market share, but their combined volume is not likely to overtake Google, at least not any time soon.

One interesting bit of data that is not included in these numbers is the increasing number of mobile searches performed each day.  Although mobile traffic data is not yet figured into total market share statistics, search engines are well-aware of users’ tendencies and are increasingly interested in promoting mobile search.  According to Titan Growth®‘s Parry Kuhn, “We are seeing close to 10% of Google’s total search traffic coming from mobile phones.  Mobile search is only going to grow from here.”

What can businesses take away from this?  Namely, that search volume overall is increasing, as is search on different platforms and in different types of media.  A company and their SEO agency following these trends will have a significant advantage over the competition.

Contributed by Amanda Finch, VP Operations

Google Analytics Version V5 Coming Soon

As the sun sets on the old Analytics interface, version v5 is coming closer to reaching fruition. While the beta version has already been available for users to try out, Google says in a matter of weeks the new version will be activated in all user accounts. You will still be able to switch back to the old version while you get your feet wet with the new interface, but only until January 2012. After January, version v5 will be fully integrated and the old version will be gone. With all the cool new features on the v5 interface, however, we don’t see any need to switch back. Here are a few of our favorite new features:

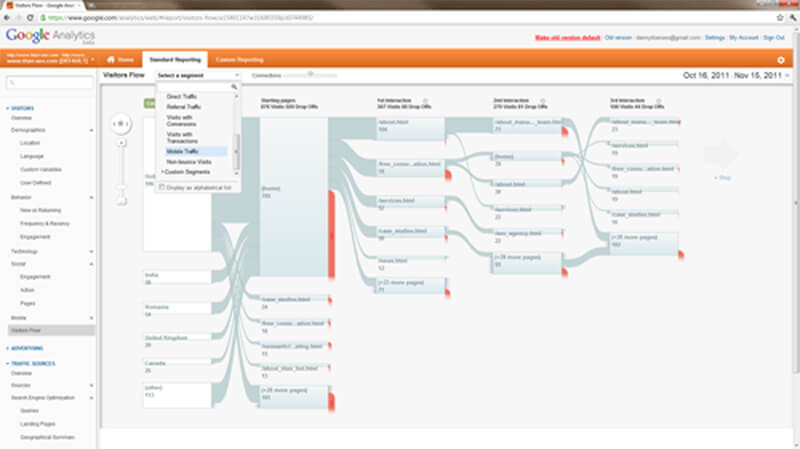
Visitor Flow


Visitor flow provides a great visual for how visitors navigate your pages and where they drop off. In the drop-down bar, you can choose what flow chart you want to see, whether it be direct traffic, referral traffic or even mobile traffic. This Google Analytics feature also lists the numbers of visitors to each page, how many go on to another page and how many drop off.

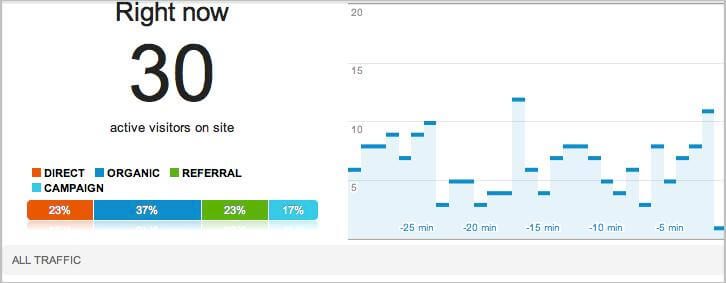
Real-Time Tracking

Real-Time Tracking provides a visual breakdown of real-time visitors to your website. You are able to see the number of visitors fluctuate as they enter and exit your website each second. You are also able to see where in the world these visitors are coming from on a map, how many pages they have visited and the amount of time they have spent on the website.

Mobile Tracking

With mobile search becoming more prominent, Google Analytics v5 has added the capability to track mobile devices, as well as iPods and iPads. The Analytics team was even nice enough to provide images for each mobile device, just in case you forget what an iPhone looks like.

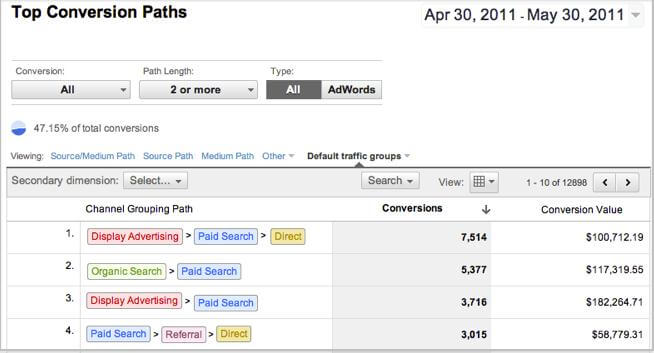
Multi-Channel Funnels and Goals Funnels

The multi-channel funnels give you a visual breakdown of what traffic sources preceded a conversion. This is a useful tool which can reveal what is more influential in yielding conversions. Under the ‘Conversions’ tab, you can find funnel visualization and goal flow, which are also unique visual tools which can help track conversions.

Key Differences Between the New and Old Versions

Even with the addition of all these new features, many of the key features of the old Analytics version have been preserved. The overall layout and menu bar have changed slightly since Google has done away with the ‘Dashboard’, ‘Intelligence’ and ‘Goals’ tabs from the old interface and added the ‘Advertising’ and ‘Conversions’ tabs on the new menu.

New tabs have been added along the top, where ‘Home’ will take you to your dashboard and ‘Standard Reporting’ will take you to the familiar reports. ‘Custom Reporting’ allows the option to create your own reports based on customized factors.

In addition to the new features, some of the key features of the older version have been switched around. For instance, the ‘Keywords’ tab, which used to be under ‘Traffic Sources’ in the older version is no longer there. Instead, you can find keyword tracking by going to Traffic Sources > Overview and your keywords are there on the right-hand side.

Even with the new features and alterations to the layout, the new Analytics platform is straight-forward and easily understood. The Analytics team did a great job of providing an enhanced version of the Analytics we love, creating a visual approach to the variables that matter most, like conversions and site navigability. We sure enjoyed experimenting with all the new features on v5 and hope you will too. If you have any questions regarding the changes, or how to use a new feature, contact your SEO Agency.

Submitted by Erica Machin, Titan Growth